Data Analytics & Music
Mixxx Dashboard: The data behind the dance floor.
This web dashboard uses Python and Dash to analyze DJ sets played in Mixxx. It turns my playback history into insights about tempo, flow, and musical storytelling.
View Live Dashboard View on GitHubDashboard overview: filtering by style and exploring trends.
Why I built this
When I am behind the decks as Dr. Beat, I play for swing dancers (Lindy Hop, Balboa) and blues dancers. The job is to read the room, build a narrative arc, and keep dancers inspired. But once the night is over, it's remarkably hard to remember the exact flow of the set, let alone track how your style evolves over months and years.
I wanted a tool to review my work. The free DJ software I use, Mixxx, stores all my history in a local SQLite database. So, combining my background in data analysis with my passion for DJing, I built this dashboard. It’s my personal post-game tape for mindful DJing, allowing me to consciously explore my style and improve my sets.
Under the hood
Try it here.
The application is built entirely in Python. It
reads the local mixxxdb.sqlite file using standard SQL queries,
processes the data with Pandas, and renders the
front-end using Dash and Plotly.
I specifically chose Dash instead of standard BI tools like Looker Studio or Power BI because it afforded me the flexibility to build highly custom interactions, like embedding Spotify iframes dynamically and having full control over the visual layouts tailored to musical analysis.
To handle the annotations and ratings for each set, I implemented an ad-hoc SQLite database. This sidecar database uses the playlist ID keys from the main Mixxx DB to augment the original data, linking my personal reflections perfectly to the respective sets generated natively in Mixxx without risking database corruption.
To make the data accessible outside of my local machine, I implemented a workflow where I periodically export my Mixxx and ad-hoc databases, stripping out file path markers, and push them to the GitHub repository where the Render web service picks them up to deploy the live app.
Deep diving the data
The dashboard offers two main lenses for analysis: the macro view across my entire history as a DJ, and the deep dive into the context of a single night.
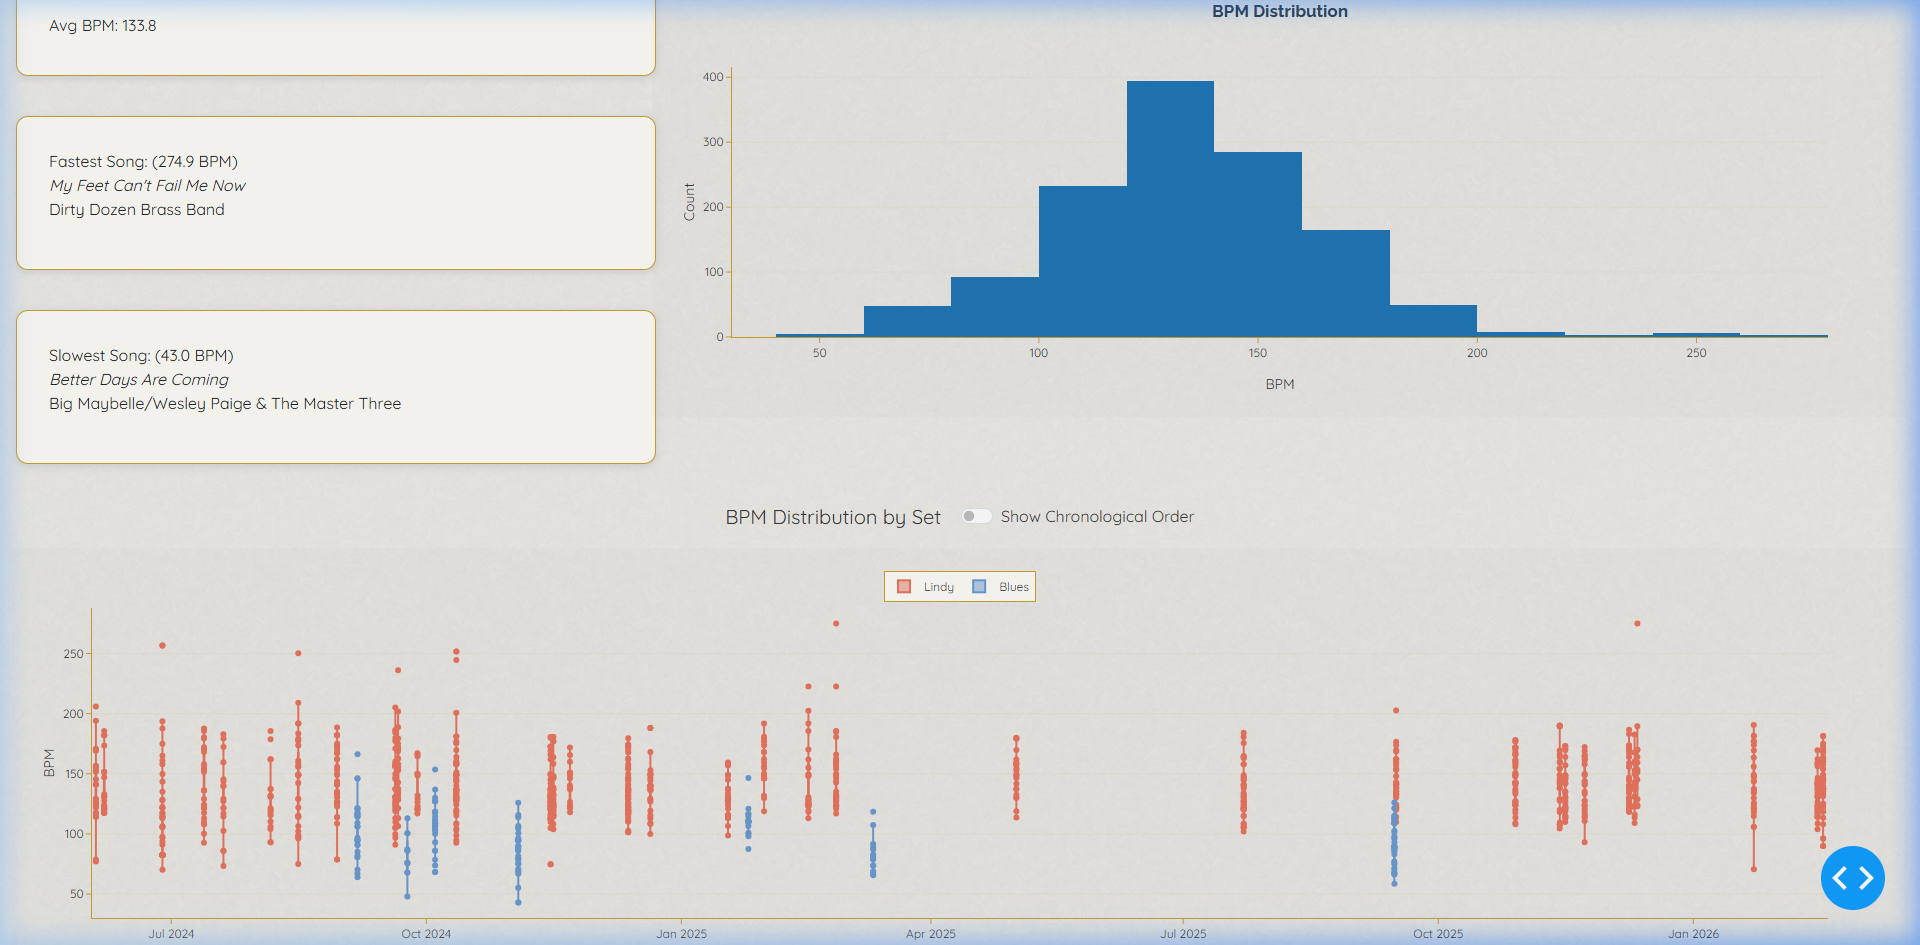
1. The Macro View (Aggregate)
At a high level, I want to understand my tendencies over time. Are my Lindy sets getting faster? Do I play too many songs by Count Basie compared to lesser-known artists? I can easily see my most played artists and most played tracks across all events.
The dashboard aggregates statistics across selected date ranges or specific styles (e.g., separating high-energy Swing sets from late-night Blues sets). It visualizes the overall BPM distribution, helping me ensure I'm providing enough tempo variety for the dancers.
I also track the percentage of songs played for the 1st time vs. 2nd time vs. 3+ times. This serves as a proxy for how much my style is settling, and measures my level of musical experimentation and risk-taking across gigs.
Click image to zoom
Click image to zoom
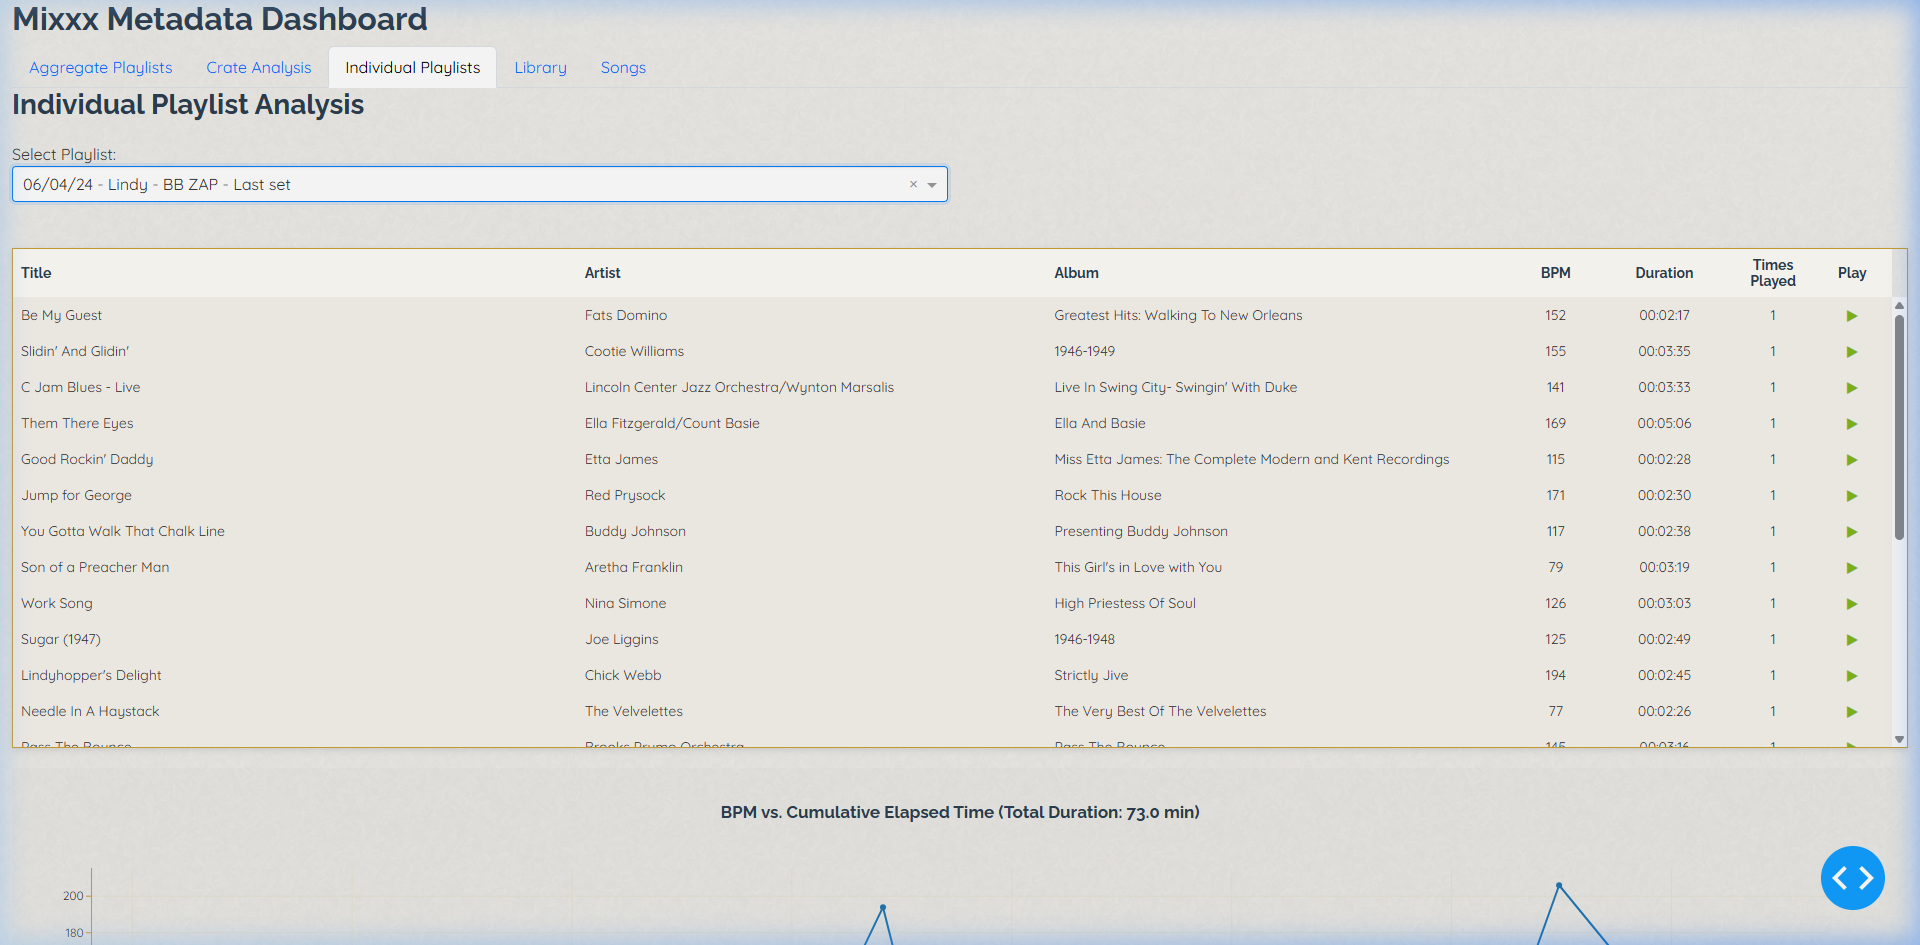
2. The Micro View (Individual Sets)
This is the post-mortem view. Selecting a specific playlist reveals the exact track sequence and the "Energy Arc," which is a line plot of BPM vs. Cumulative Elapsed Time.
This view provides the vital context that explains macro metrics. For example, if I DJ for beginner dancers, I might play mostly safe mid-tempo classics, limiting experimentation. But with an advanced crowd, I take more risks.
But seeing a title isn't always enough to remember a song's vibe. I integrated the Spotify Web Playback API using Dash HTML components. As long as I've synced my Mixxx library IDs, clicking a simple `▶` icon loads the track directly into an embedded Spotify player on the dashboard for instant recall.
At the end of each set analysis, there is a section for annotations. I assign a simple 1-5 rating on how the night felt, and note down which song transitions worked brilliantly and which cleared the floor. I can also instantly recreate the set on Spotify with a single 1-click export button to share the playlist with the dancers.
Explore More
From analysis to real-time action
The web dashboard works great for the day after a gig. Want to see how I track this data live in the booth, or hear the music behind it?
Mixxx DJ Buddy
I later built a desktop companion app in Go and D3.js that runs alongside Mixxx. It reads the same SQLite database but visualizes the BPM flow and track metadata live as the set happens.
Learn about DJ Buddy →Dr. Beat Playlists
Curious about the music that inspired these analysis tools? Visit the playlists page to explore the authentic swing and jazz sets I play for dancers.
Listen to the sets →