Can AI build my website, and audit it too?
I asked the new Gemini 3.1 Pro to step in as my website's analyst.
Over the past year, I built this website using AI coding assistants. Because of that, the agents already know my entire codebase and design architecture.
I also maintain a Looker Studio dashboard that tracks daily PageSpeed scores. Usually, my workflow is manual. I read the dashboard, spot a performance drop, and prompt the AI to help me fix the code.
When Google released Gemini 3.1 Pro through Antigravity last week, I wanted to test a specific multimodal upgrade. What happens if I remove myself as the middleman? Could the model actually see a live, interactive web report, navigate the charts like a human analyst, and write its own technical audit?
I designed a straightforward test. The agent had to navigate the dashboard, find the performance metrics, write an audit report, and implement its proposed fixes directly into the codebase.
The setup
I built a custom analytics pipeline for this site using GA4, BigQuery, and Looker Studio. Part of it is a daily PageSpeed audit. A threaded Python Cloud Function reads my sitemap, calls the PageSpeed Insights API seven times per page, and stores the results in BigQuery. Performance scores naturally vary between runs. To get a stable reading, the dashboard shows the median of those 7 measurements. Only the Performance metric has a wide spread; the others (SEO, Accessibility, Best Practices) are essentially deterministic.
I pointed a Gemini 3.1 Pro agent at the report URL and gave it a simple directive. Read the charts, produce a technical audit, and verify your findings against the codebase. I provided no hints.
Step 1: Navigating the dashboard
The first hurdle tested its multimodal reasoning. I gave it access to my personal dashboard. It had to use a headless browser, understand the visual layout, and click the right tabs.
It successfully opened the Looker Studio report, clicked the "Page speed" tab, and navigated to the "Current state" section.
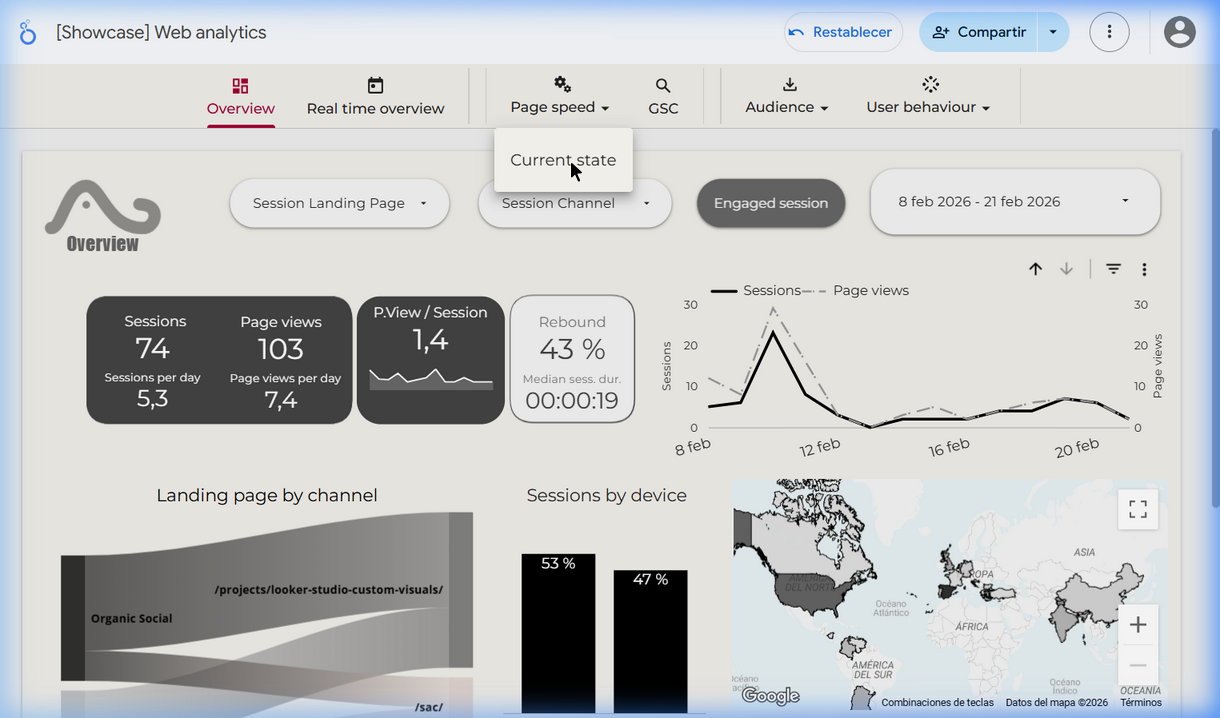
Correctly finding the Page speed → Current state section
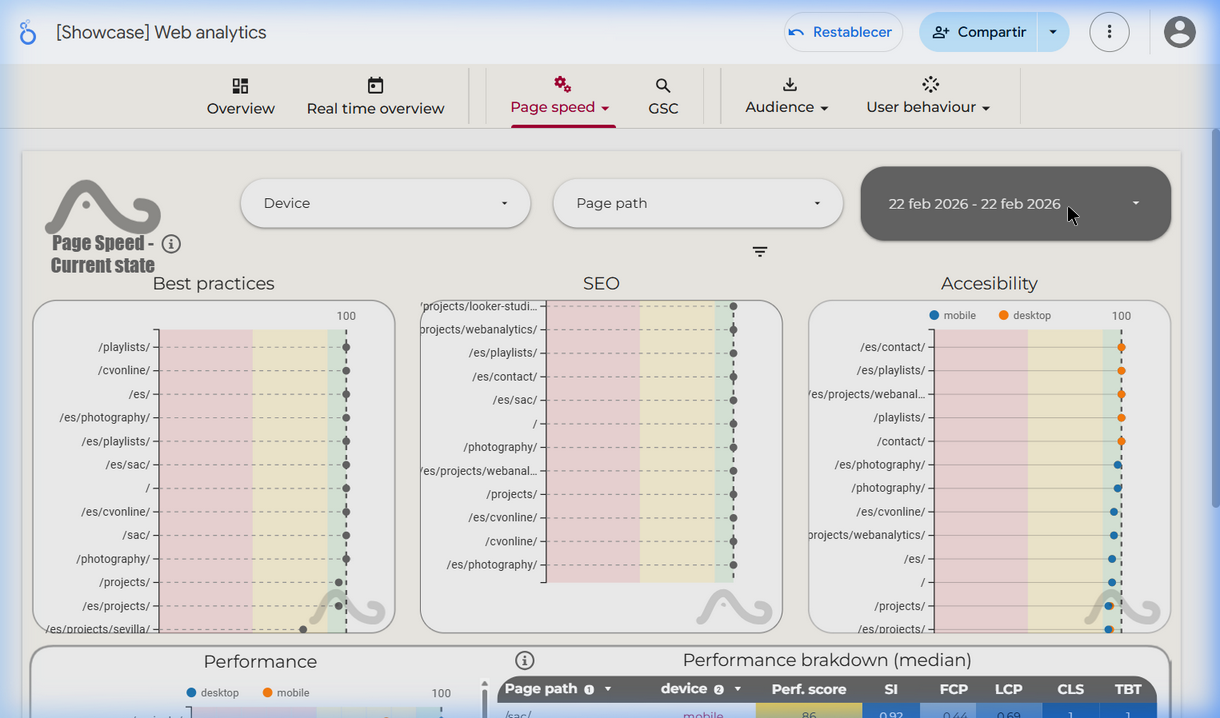
The PageSpeed dashboard with Best Practices, SEO and Performance charts
Step 2: The date incident
A first hiccup occurred almost immediately. The dashboard has a date range filter. Without any instruction, Gemini opened it and started typing. It entered "028" into the offset field, accidentally pulling the data window back 28 days. I did not ask it to filter historical data. This proactive behavior was a small telltale of things to come.
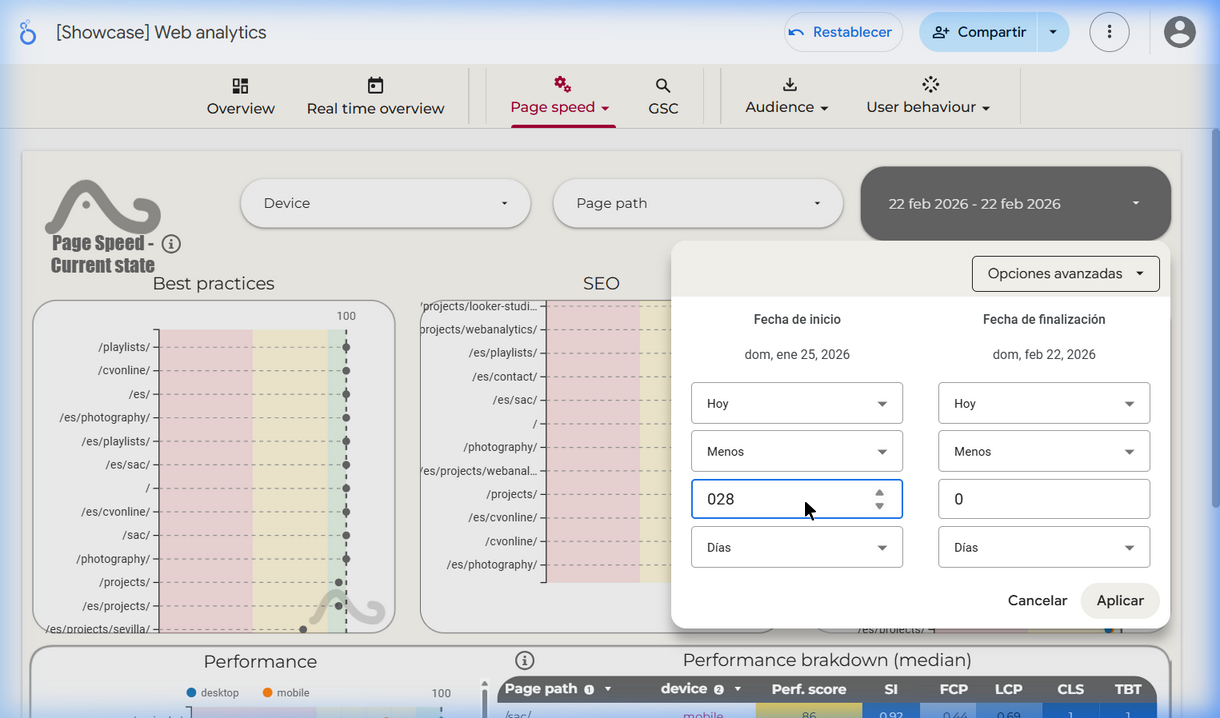
The model proactively opened the date filter and typed "028" — expanding scope without being asked.
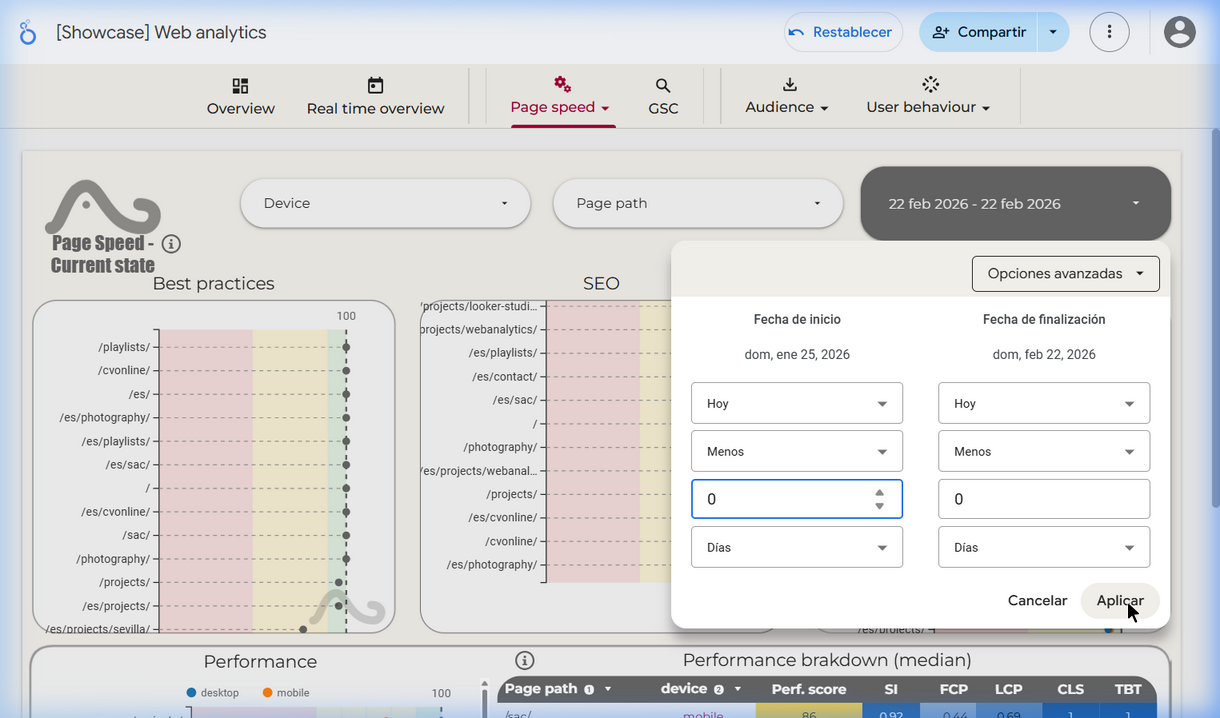
After my correction: filter set cleanly to 22 Feb 2026 – 22 Feb 2026
I sent a short correction and it applied the right date immediately. I have noticed this behavioral difference when comparing Gemini to Claude. Gemini tends to act outside its original instructions without checking in. Claude usually pauses to ask for confirmation. Neither approach is universally better, but for tasks involving live production data, you have to keep this in mind.
Still, compared to Gemini 3.0, the navigation was a massive improvement. The older model would loop endlessly on screenshots or completely lose track of the report UI. 3.1 Pro only needed one minor correction.
Step 3: Reading the scrollable charts
With the date set, the AI scrolled through the performance charts. This included the interactive "Performance breakdown (median)" table, which lists every page path with device-specific scores for Speed Index, FCP, LCP, CLS, and TBT.
Reading this table requires scrolling within an embedded element inside the main page. Previous model versions failed completely at this specific interaction.
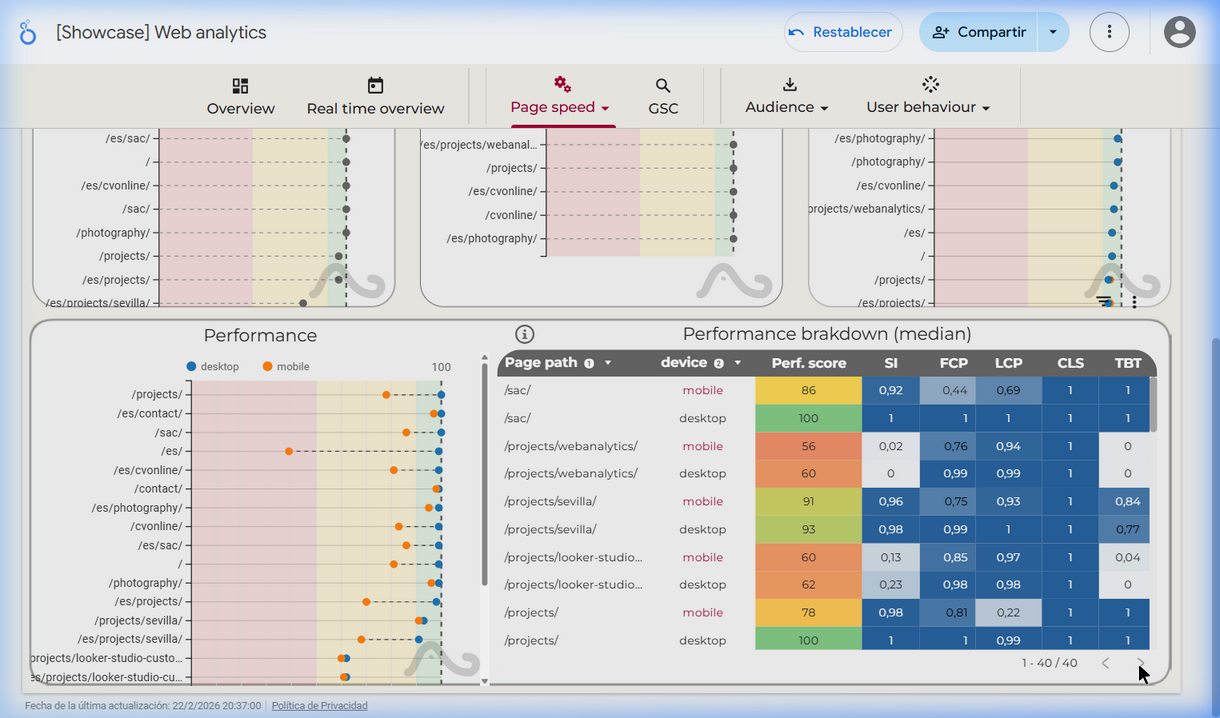
The scrollable performance table showing per-path, per-device breakdown of all Core Web Vital metrics
The audit report
Based on the dashboard data, Gemini 3.1 Pro generated the following technical audit. It identified the bottlenecks, scored them by severity, and proposed fixes.
↕ Scroll within the box to read the full report
Executive Summary
The website demonstrates excellent baseline capabilities on Desktop, but suffers from severe performance degradation on specific Mobile pages. The primary bottlenecks are excessive main-thread blocking (TBT) on pages with heavy interactive components and delayed visual rendering (Speed Index) for mobile users.
Key Performance Metrics — 22/02/2026
| Page | Device | Score | SI | FCP | LCP | TBT | CLS |
|---|---|---|---|---|---|---|---|
| /sac/ | Desktop | 100 | 1.0 | 1.0 | 1.0 | 1.0 | 1.0 |
| /sac/ | Mobile | 86 | 0.92 | 0.44 | 0.69 | 1.0 | 1.0 |
| /projects/ | Desktop | 100 | 1.0 | 1.0 | 0.99 | 1.0 | 1.0 |
| /projects/ | Mobile | 78 | 0.98 | 0.81 | 0.22 | 1.0 | 1.0 |
| /projects/webanalytics/ | Desktop | 60 | 0.0 | 0.99 | 0.99 | 0.0 | 1.0 |
| /projects/webanalytics/ | Mobile | 56 | 0.02 | 0.76 | 0.94 | 0.0 | 1.0 |
| /playlists/ | Desktop | 60 | 0.02 | 1.0 | 0.99 | 0.0 | 1.0 |
| /playlists/ | Mobile | 55 | 0.0 | 0.89 | 0.81 | 0.03 | 1.0 |
| /projects/looker-studio-… | Desktop | 62 | 0.23 | 0.98 | 0.98 | 0.0 | 1.0 |
| /es/ (home) | Mobile | 39 | 0.54 | 0.53 | 0.03 | 0.09 | 1.0 |
| /es/projects/ | Mobile | 70 | — | — | 0.01 | — | 1.0 |
Note: CLS is perfect (1.0) across all pages — the layout is stable everywhere.
Findings, by Priority
1. TBT Critical — JavaScript Execution Wall
Pages embedding third-party iframes (/projects/webanalytics/, /playlists/, /projects/looker-studio-custom-visuals/) have a TBT score of 0.0. The browser's main thread is completely locked during load. Users cannot scroll or interact until the JS payload clears.
2. Speed Index — Blank Screen Syndrome
The Speed Index on /projects/webanalytics/ and /playlists/ is near 0.0, meaning the page renders almost nothing visible for a long window during load. There are no skeleton screens or progressive reveal.
3. Mobile LCP — /projects/ Listing Page
/projects/ is a perfect 100 on desktop. On mobile, LCP drops to 0.22. The hero section contains autoplay videos and large unoptimized images served at desktop resolution.
4. Spanish Localization (/es/) — Worst Mobile Scores
Scrolling through the chart reveals the /es/ paths show catastrophically low mobile LCP (0.01–0.03) and the worst overall performance scores. Hypothesis: a render-blocking payload specific to the localization layer.
Recommendations
Tier 1 — TBT: Add lazy loading to iframes. Use IntersectionObserver to defer initialization until the embed is in view. Consider a Facade pattern (show a static image, load iframe on click).
Tier 2 — Speed Index: Add skeleton screens for heavy sections. Inline critical CSS.
Tier 3 — Mobile LCP: Add srcset and sizes to hero images. Preload video poster frames with fetchpriority="high".
Step 4: Verifying hypotheses in code
Next, I asked the agent to verify its guesses by scanning the actual Astro source code. This closed the loop perfectly.
The agent correctly identified that the
webanalytics.astro file
loads the Looker Studio iframe immediately with no loading="lazy" attribute. The playlists page repeats this mistake for the primary Spotify
embed.
The markup includes a loading spinner. The iframe request fires immediately underneath it anyway. This clogs the network before the spinner can even render cleanly.
Hero images use
fetchpriority="high" but lack a srcset attribute. The site serves heavy desktop-resolution assets to mobile devices.
The autoplay video poster is also missing a preload tag.
The
/es/ pages are physically separate Astro files. They share
an identical structure with the English versions. There is no heavy localization
framework running client-side. The extreme LCP scores on those pages were likely
measurement noise from that specific synthetic crawl, not a code defect.
Three out of four hypotheses proved correct. The fourth was correctly falsified. The AI looked at real data, generated a plausible but wrong explanation for the Spanish pages, and then corrected its assumption when the code didn't support it.
Fixes applied
After verifying the issues, I instructed the agent to implement the non-disruptive fixes.
-
Added
loading="lazy"to the Looker Studio iframe on both English and Spanish web analytics pages. -
Added responsive
widthsandsizesattributes to hero images on the project listing pages. -
Preloaded the video poster using a
<link rel="preload">tag in the document head.
Update (Feb 23): I checked the dashboard today to measure
the impact. The TBT on the webanalytics page was still 0.0. Adding loading="lazy" to an above-the-fold iframe does not stop Lighthouse from eagerly executing
it. The browser sees it in the initial viewport and downloads it immediately.
A true fix requires a Facade pattern, where a static image renders until the
user clicks. Gemini actually suggested this as its top recommendation in the
audit. Implementing it would break the immediate interactive experience of
the page. The AI accurately diagnosed the problem and proposed the mathematically
correct fix, but it lacked the judgment to weigh performance scores against
broader user experience goals.
Follow-up explorations
The Looker Studio dashboard shows the median of seven daily test runs per page. To really understand the performance hit, we have to look at the full distribution. I asked the AI to write a Python script to pull the raw data from BigQuery and plot the actual spread of the Performance Score and TBT metrics across both days.
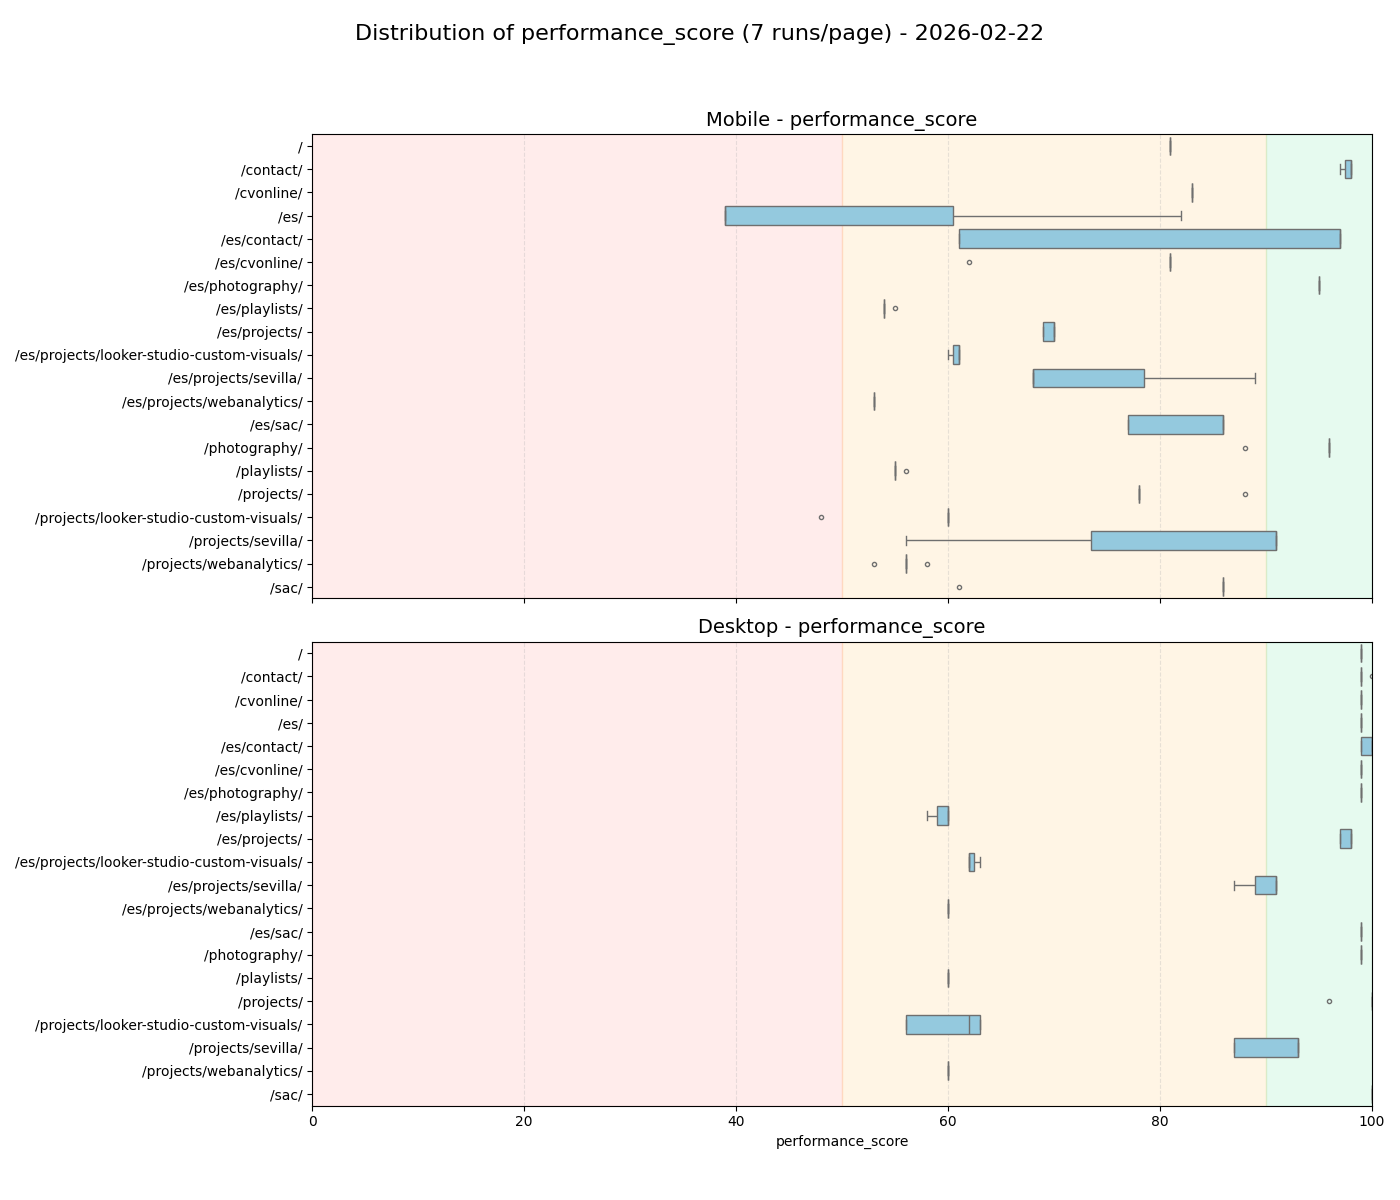
Feb 22: You can clearly see the massive variation in scores on the
mobile /projects/webanalytics/ page.
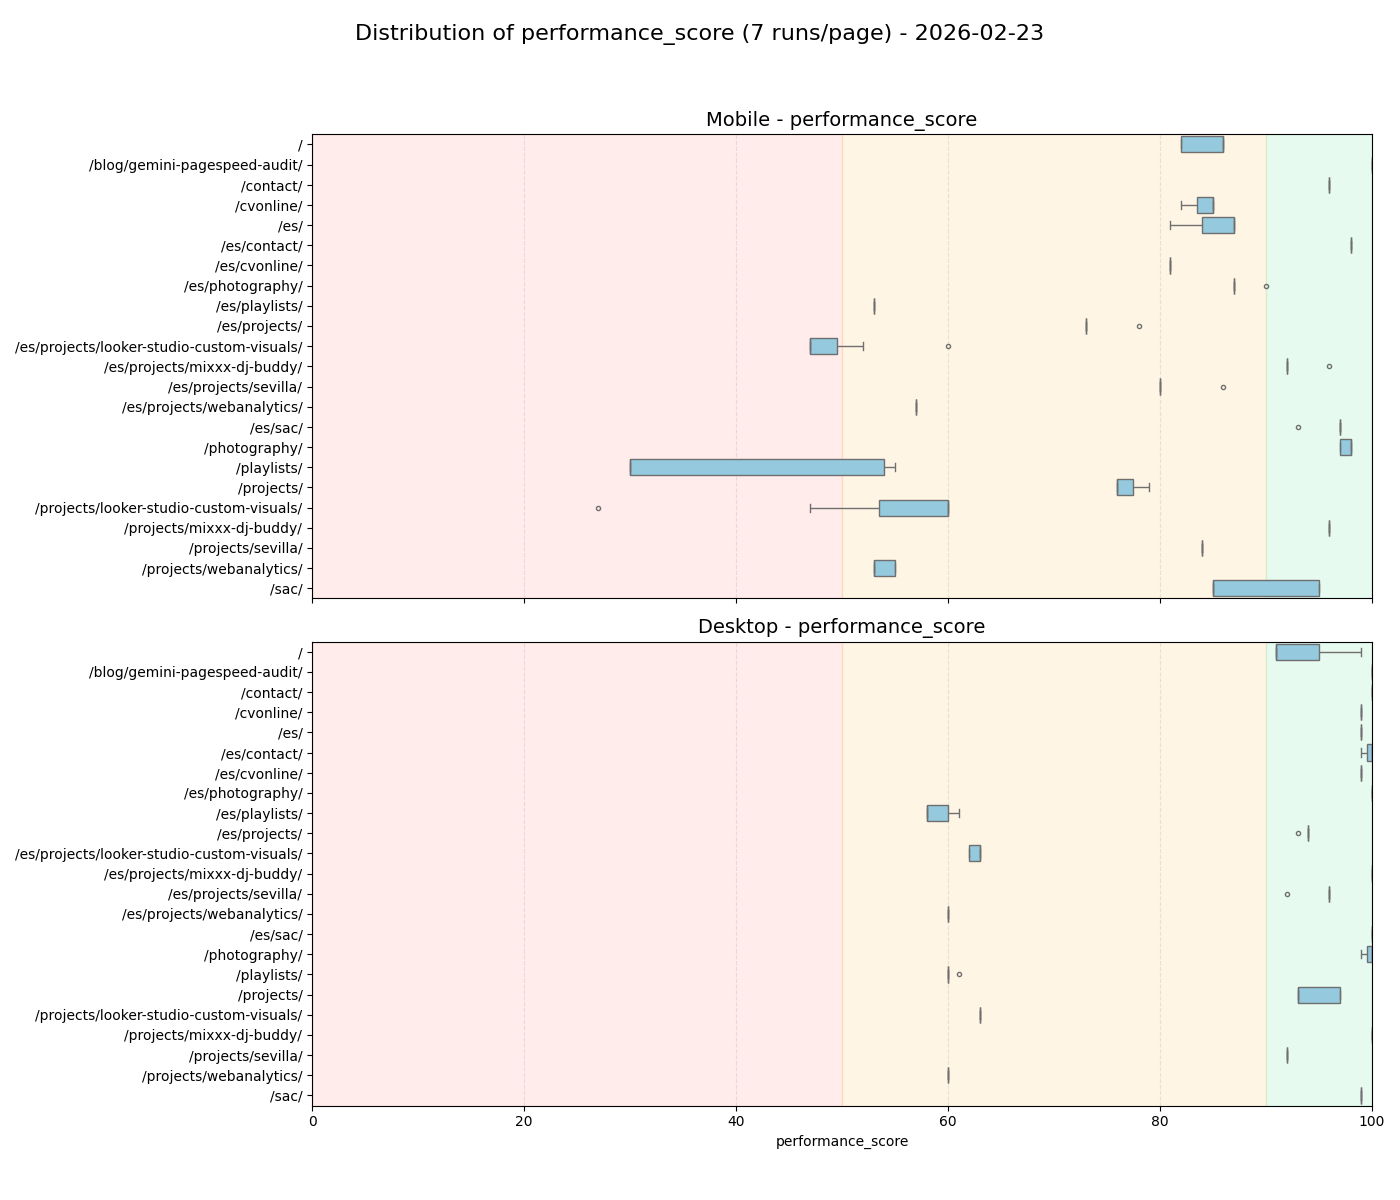
Feb 23: After the "fix", the variance on the heavy pages remains largely identical.
The boxplots show exactly why the native lazy loading attempt failed. The main thread is blocked consistently for thousands of milliseconds across every single run. A true Facade approach is the only technical way around it.
The real takeaway here is the workflow itself. An AI agent can read your codebase, access your live analytics data, and run its own experiments to test hypotheses like a human analyst.
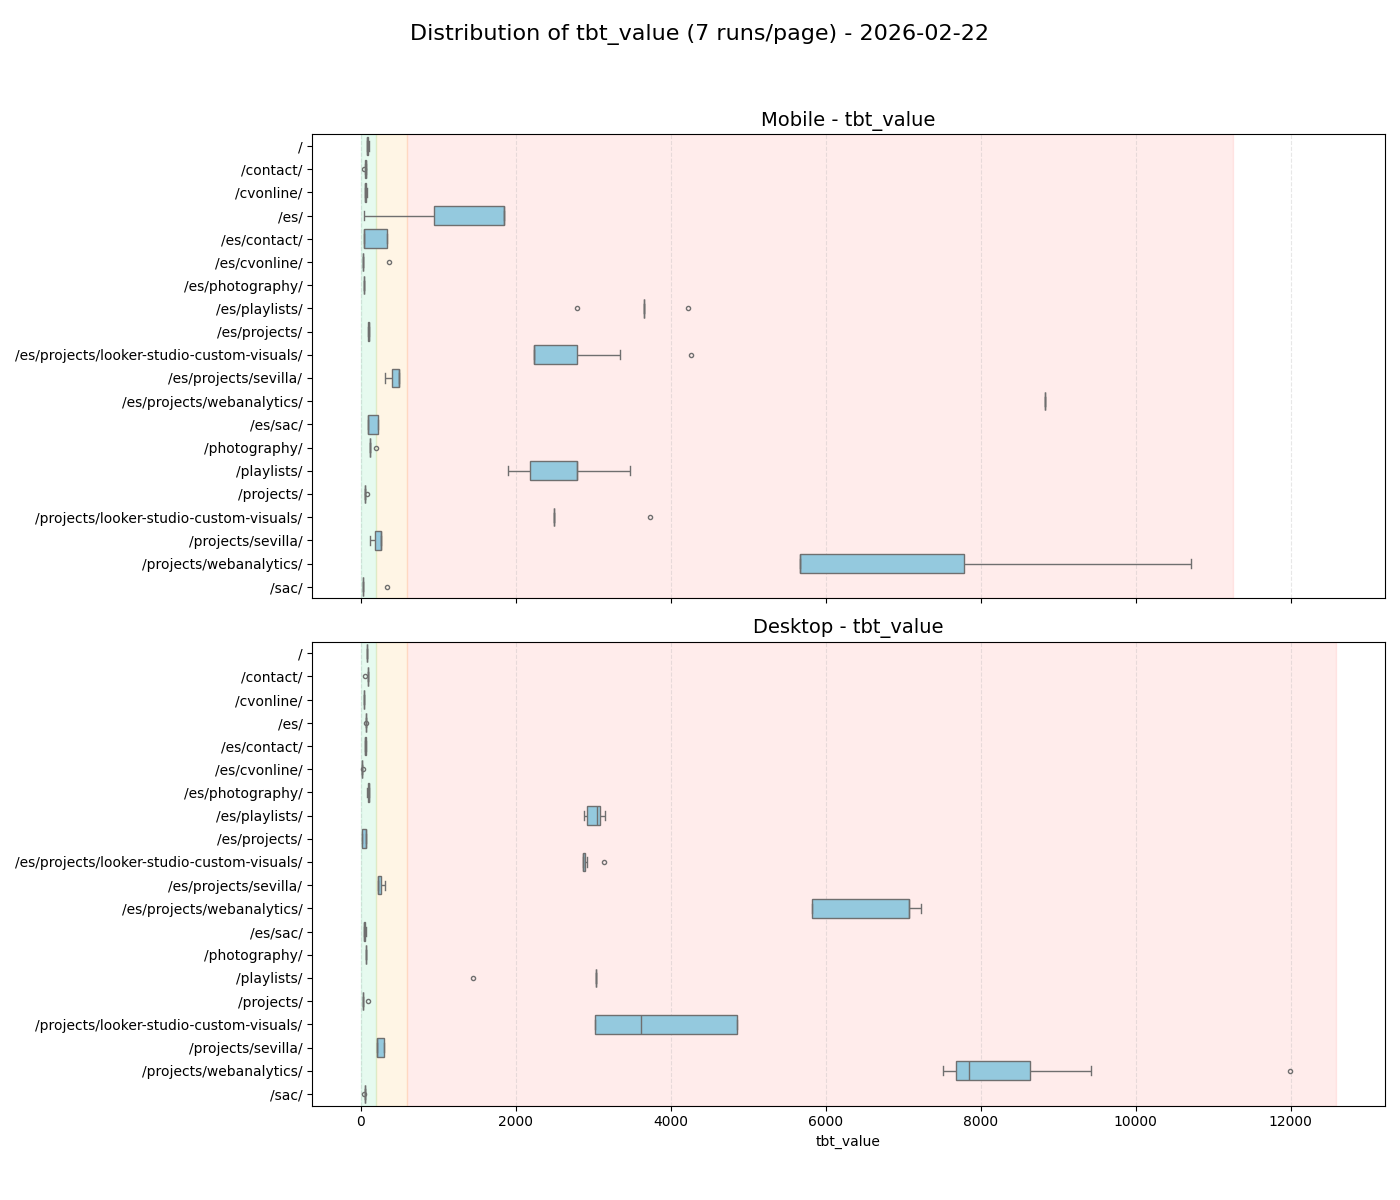
Feb 22: Unacceptable TBT spread on the heavy iframe pages.
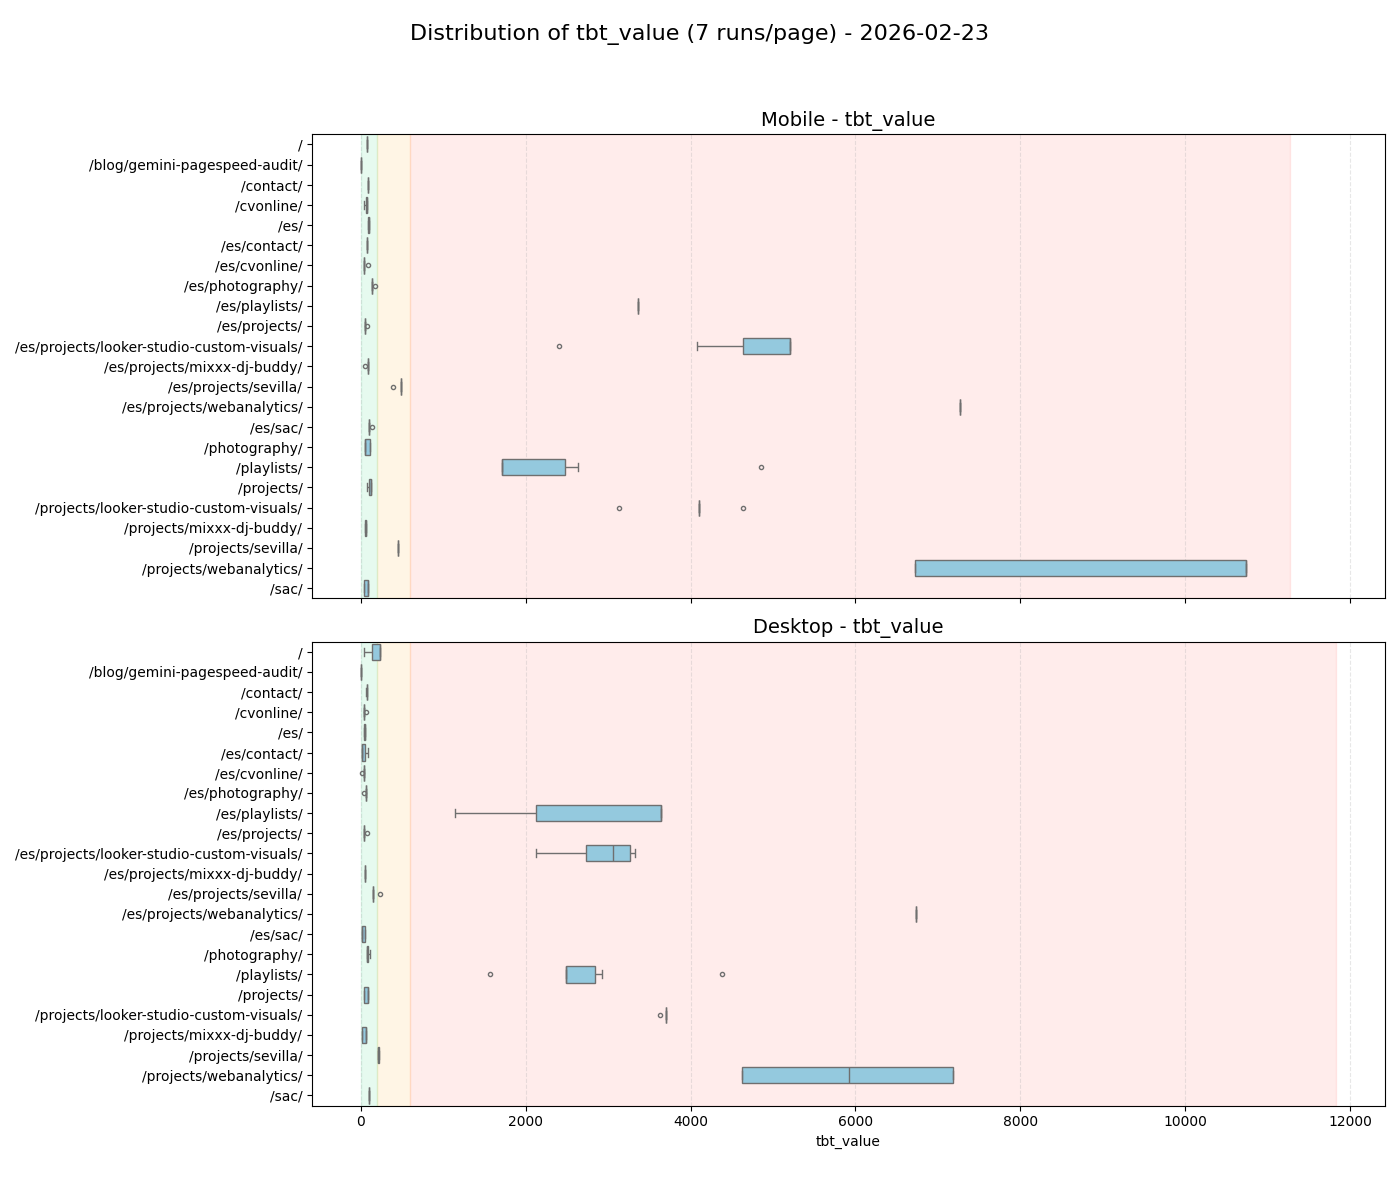
Feb 23: Native loading="lazy" on above-the-fold content provides
zero relief.
Reflections
Audit results
The distribution plots revealed three things that the median scores masked.
- The Astro foundation is solid. The lightweight pages (like
/sac/or this very blog post) clustered tightly around 90-100. The performance bleed is entirely isolated to third-party embeds. - The "/es/ ghost" was just noise. The Looker Studio audit originally flagged the Spanish home page for a catastrophic mobile score of 39. The distribution on Feb 22 showed massive variance. By Feb 23, that variance vanished and the score clustered tightly at 85. We were chasing a ghost born from network jitter.
- The variance simply shifted. On the 22nd,
/sevilla/was the unstable outlier. On the 23rd, it stabilized while/playlists/became wildly unpredictable.
Hunting performance bugs using a single day's median score is misleading.
The dashboard alerted me to a baseline problem. But only by looking at the
distributions across multiple days do you see the truth. The framework is
stable, but third-party embeds introduce massive latency spikes that
native loading="lazy" tags cannot fix.
Can Gemini 3.1 audit my website?
This experiment worked better than I expected for a first try. It highlights a workflow I had not previously used: asking the AI to interpret a live report, cross-check its findings against the code, and validate those assumptions using raw data distributions.
However, the process also exposed significant flaws. Gemini 3.1 is far too eager to act without asking. For exploratory, low-stakes tasks, this is acceptable. For anything involving production data or deployment, you have to enforce strict scope boundaries upfront.
The bigger downside is the lack of good criteria that take the broader picture into account. Its technical suggestions rely on sound logic, but it completely lacks the judgment to realize when a suboptimal codebase is a necessary tradeoff for a better user experience.
Overall, the new model shows clear improvements. But we have not reached the point where we can rely on these agents to make important decisions.