Free Power BI Custom Visuals
A collection of 100% free, open-source custom visuals I've developed for Microsoft Power BI, extending its capabilities with specialized chart types for better data storytelling.
Visualizations Included
-
 Lipstick Bullet Chart - A free specialized chart type for comparing real values against targets with a distinctive, high-density visual style.
 -
 Intensity Matrix Heatmap - A high-performance heatmap visual for Power BI, featuring professional scientific colormaps (Viridis, Inferno, Turbo) and advanced data science capabilities.
 -
 Text Card Grid - A highly configurable qualitative visual presenting descriptive text cards with responsive grid structures, version changelogs, timelines, or split readers.
Below you can see detailed demonstrations and technical explanations for the visuals.
Lipstick Bullet Chart
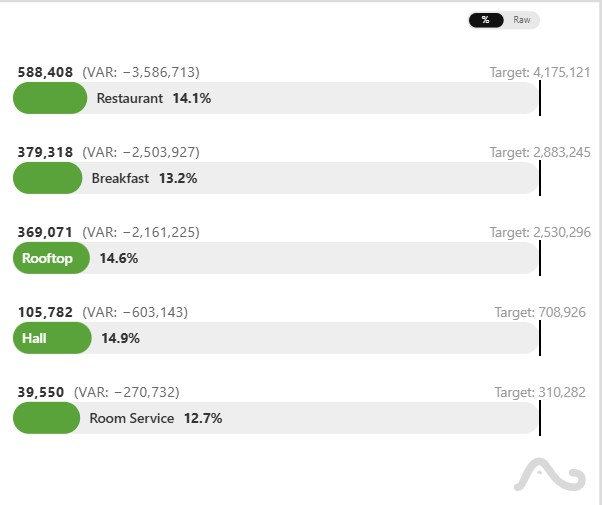
The Lipstick Bullet Chart packs actual value, target, completion percentage and absolute variance into a single compact bar.
By combining multiple data points into a single graphical element, it provides a comprehensive view at a glance, effectively replacing the need for separate KPI cards, bar charts, and data tables.
Intensity Matrix Heatmap
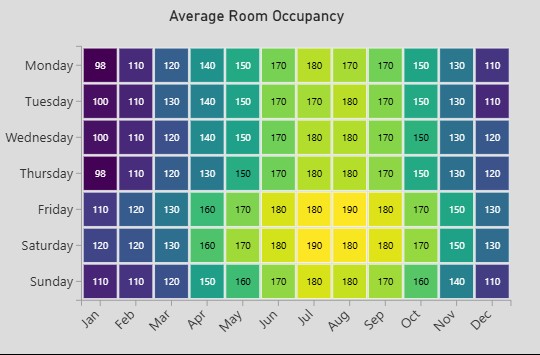
The Intensity Matrix is a high-performance heatmap visual focusing on professional scientific colormaps (Viridis, Inferno, Turbo) and advanced data science features.
Key capabilities include:
- Advanced Scaling: Linear, Logarithmic, and Power scales.
- Diverging Scales: Configurable midpoint scaling for RdBu, PiYG, etc.
- Auto-Scaling & Robust Normalization: Quantile-based normalization and data clipping.
Built with D3.js and the Power BI SDK for high interactivity including tooltips and cross-filtering.
Text Card Grid
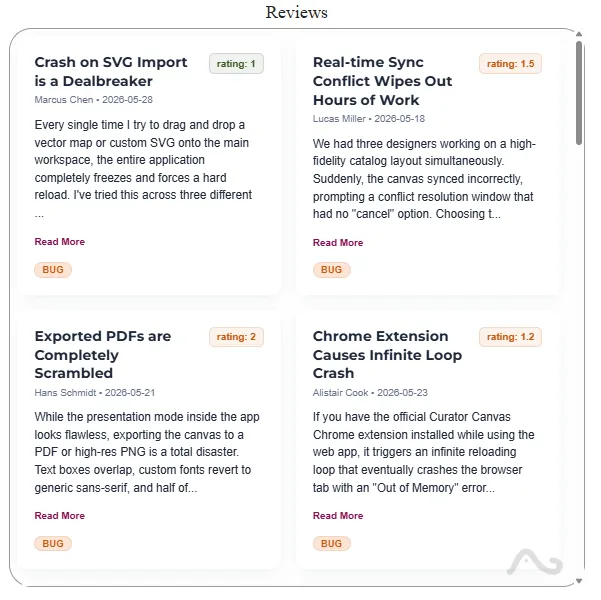
The Text Card Grid brings responsive, structured text and qualitative narrative capabilities directly into Power BI dashboards. It perfectly bridges the gap between raw data metrics and textual annotations.
It features responsive columns layout, vertical timeline streams, custom metric labels, and robust paragraph preservation.
Download & Use (100% Free & Open Source)
These custom visuals are MIT licensed and completely free to download and use in your commercial or personal reports. You can download the
compiled .pbiviz files directly from the GitHub repository and import them
into Power BI Desktop.
How do I install them?
- Download the
.pbivizfile from the GitHub repository. - Open Power BI Desktop.
- In the Visualizations pane, click the three-dot menu and select "Import a visual from a file".
- Select the downloaded file and confirm.